
|
Create a PIE CHART showing your knowledge of percentages, fractions and angles. Here is an example of a Pie Chart or a Sector Graph: 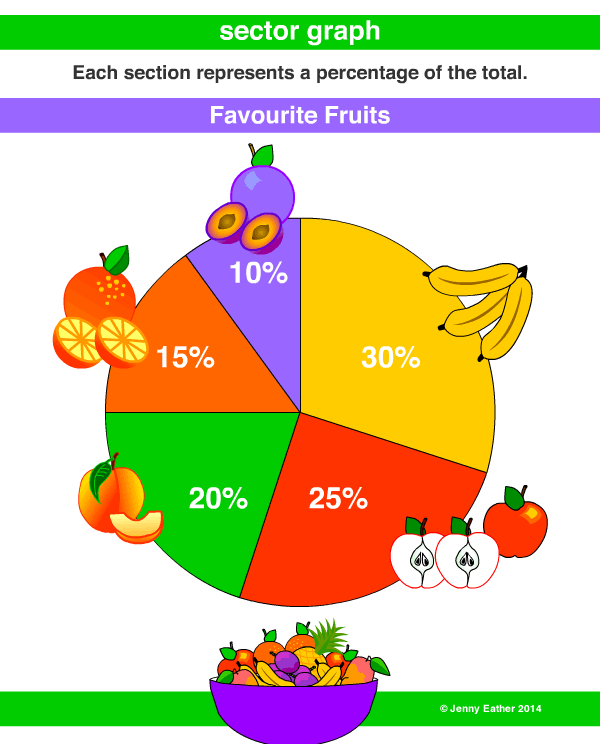 Your assignment is to ask 10 people on 'What makes a peaceful society?'
You need to come up with - Your own worded question - A range of answers (4 to 5) - Ask 20 people (can be in class/friends/family/yourself) After you have found your results, collate it into a PIE CHART. Some things you need to consider are - How many degrees in your pie chart would represent 1 person? (Remember how many degrees in a circle and how many people you interviewed) - What would each answer look like as a fraction or a percentage? When you produce your pie chart include * Title * Question * Answers * Label your pie chart with different colours * Include fraction/percentage in your answers
0 Comments
Leave a Reply. |
Grade 6 at Hillside World AcademyMr. Tan - Homeroom teacher, UOI English, English language Archives
June 2017
Categories |
Search by typing & pressing enter
 RSS Feed
